



The Bitcoin price has become one of the most closely watched metrics in the cryptocurrency market, with investors and traders constantly analyzing potential support levels and resistance points. Over the past several months, the digital currency has experienced significant volatility, leading many market participants to question whether we’re approaching a realistic bottom for the current market cycle. The proposed $42,000 to $44,000 price range has emerged as a critical technical level that could signal either continued bearish pressure or the beginning of a recovery phase.
Understanding where Bitcoin might find sustainable support is crucial for both institutional and retail investors looking to make informed decisions. The cryptocurrency market operates differently from traditional financial markets, with sentiment, macroeconomic factors, and on-chain metrics all playing significant roles in determining price direction. When major digital assets like BTC begin showing signs of stabilization near key support levels, it often attracts buyers who believe they’re purchasing at or near the bottom of a downtrend.
This article explores the technical and fundamental factors that could support the theory that Bitcoin is eyeing a potential bottom around the $42,000 to $44,000 range. We’ll examine historical price patterns, support and resistance levels, on-chain analysis, market sentiment, and expert perspectives to determine whether this level could mark the end of the current bearish phase. Whether you’re a seasoned crypto trader or a long-term Bitcoin investor, understanding these dynamics will help you navigate the current market conditions with greater confidence.
Bitcoin’s Current Market Position and Recent Price Action
Bitcoin’s recent price movements have painted an interesting picture of market dynamics, with the cryptocurrency fluctuating around critical support and resistance levels. The current market environment reflects a delicate balance between sellers looking to exit positions at lower prices and buyers seeking entry points after significant declines. Understanding where BTC has been trading provides essential context for evaluating whether $42,000 to $44,000 represents a meaningful support zone.
Historical Context and Volatility Patterns
The Bitcoin market has always been characterized by extreme volatility, with the leading cryptocurrency capable of experiencing 20-30% moves within relatively short timeframes. However, the current bearish environment has tested the resolve of many investors who accumulated digital assets during previous bull markets. Historical data shows that when Bitcoin price breaks below previously established support levels, it often searches for the next major support zone, which frequently aligns with previous resistance levels or psychological price points.
The cryptocurrency landscape has evolved significantly since Bitcoin’s inception, with institutional adoption, regulatory developments, and macroeconomic factors now playing substantial roles in price discovery. The recent pullback from higher levels has many asking whether the current drawdown represents a healthy price correction within a longer-term uptrend or something more severe. Technical analysts who study Bitcoin charts regularly point out that support levels near round numbers like $40,000 and $45,000 often attract significant buying interest, creating natural gathering points where bearish momentum may lose steam.
Technical Analysis: Key Support Levels and Resistance Points
Understanding the $42K–$44K Support Zone
The Bitcoin support level at $42,000 to $44,000 carries significant weight for several reasons that extend beyond simple arbitrary numbers. This range represents a previous resistance zone from earlier market cycles, and in technical analysis, old resistance often becomes new support when prices decline. The zone also aligns with several moving averages that are closely monitored by crypto traders and institutional investors who rely on technical indicators to guide their decisions.
When Bitcoin approaches critical support levels like this one, the concentration of buy orders tends to increase substantially. BTC investors who missed earlier entry points often place limit orders at these levels, anticipating that the cryptocurrency will bounce back upward. Similarly, long-term Bitcoin holders often view deeper declines as buying opportunities, and they accumulate additional positions when prices approach previously identified support zones. This natural buyer activity can create a self-fulfilling prophecy where the very expectation of support at these levels helps manifest that support.
Resistance Levels Above Current Price
Understanding where resistance lies above the current Bitcoin price is equally important for traders attempting to identify potential recovery targets. If BTC successfully holds above the $42,000 to $44,000 support and begins an uptrend, the next logical resistance zone would be the previous swing highs and key technical levels that rejected higher prices during earlier attempts to climb. This information helps cryptocurrency traders set realistic expectations for how far a recovery might extend before encountering selling pressure again.
On-Chain Analysis and Network Health Indicators
Beyond traditional technical analysis, the blockchain itself provides valuable data through on-chain metrics that reveal the behavior of large Bitcoin holders and network participants. These indicators have become increasingly important for serious crypto analysts attempting to determine whether the market is truly oversold at current levels.
Large Holder Accumulation Patterns
One of the most bullish signals that often precedes Bitcoin recovery is increased accumulation by large holders, commonly referred to as “whales” in the cryptocurrency community. When on-chain analysis reveals that entities holding substantial BTC quantities are buying during bearish periods, it suggests that sophisticated investors believe current prices offer compelling value. The $42,000 to $44,000 range has shown evidence of increased transaction activity at these lower levels, which could indicate that major players are positioning themselves for a potential recovery.
The concept of Bitcoin accumulation by large holders is particularly significant because these entities have the resources and expertise to make informed investment decisions. When the digital asset experiences sharp declines, institutional investors and high-net-worth individuals often deploy capital to acquire Bitcoin at discounted prices. Monitoring these whale wallets and tracking their activities provides valuable signals about what the smartest money believes about future cryptocurrency price direction.
Transaction Metrics and Network Utilization
Another crucial aspect of on-chain analysis involves examining transaction volumes, fee structures, and network utilization rates. When Bitcoin network activity remains robust despite price declines, it suggests that the fundamental utility of the cryptocurrency hasn’t deteriorated—people are still using BTC for transactions despite lower valuations. This distinction matters because it indicates that the price decline may be purely a valuation adjustment rather than a sign of fundamental breakdown.
Market Sentiment and the Capitulation Model
Cryptocurrency market sentiment often reaches extreme levels during significant downtrends, and understanding where we stand on the sentiment spectrum helps identify whether we’re approaching a market bottom.
Measuring Fear and Greed in Crypto Markets
The Fear and Greed Index, specifically designed for the cryptocurrency market, provides a quantitative measurement of market sentiment. When this index approaches extreme lows, it historically has preceded Bitcoin recovery and marked the end of bearish periods. The current environment shows sentiment levels that are approaching historically oversold conditions, which aligns with the theory that we may be nearing a bottom for Bitcoin around the $42,000 to $44,000 level.
Bear market psychology often follows predictable patterns, with investors moving through phases of hope, panic, and eventually capitulation. Once capitulation—the point where the last remaining sellers finally give up—is reached, the selling pressure typically exhausts itself. Many crypto analysts believe the current market is transitioning toward this capitulation phase, which would align with a price bottom at these lower levels.
Social Media Activity and Retail Investor Behavior
Interestingly, extreme bearish sentiment often accompanies Bitcoin bottoms. During peak pessimism, retail investors abandon the market entirely, and discussions about cryptocurrency become increasingly negative on social media platforms. The absence of retail participation is actually a bullish sign, as it suggests that the weak hands have been shaken out, leaving primarily committed long-term investors and institutional participants. This dynamic frequently precedes significant Bitcoin recoveries.
Macroeconomic Factors Influencing Bitcoin Price Direction
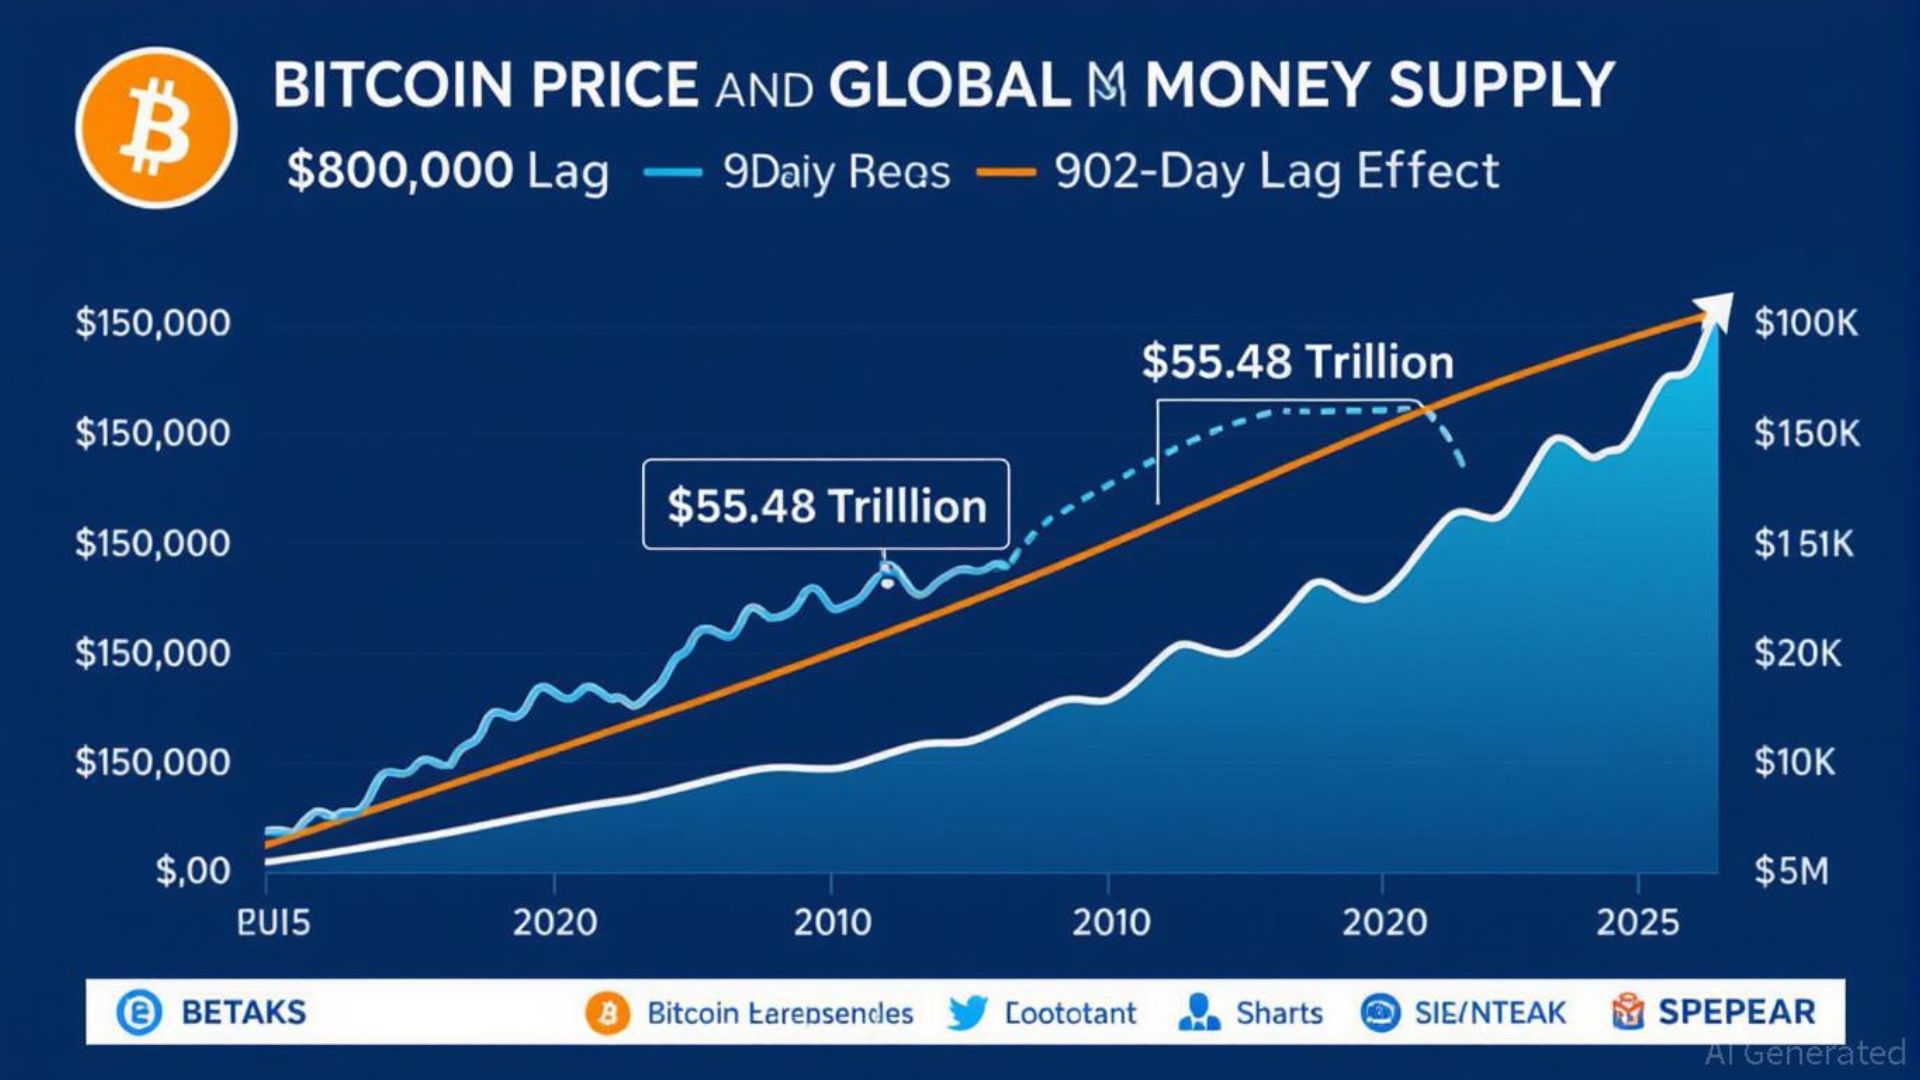
Bitcoin, often described as “digital gold,” has become increasingly correlated with macroeconomic conditions, particularly around interest rates, inflation expectations, and risk-on sentiment in broader financial markets.
Interest Rate Environment and Monetary Policy
The Federal Reserve’s monetary policy stance significantly impacts Bitcoin price movements, as investors often shift their portfolio allocations based on real interest rates and inflation expectations. In environments where interest rates are rising or expected to remain elevated, investors may prefer lower-risk alternatives or income-generating assets, reducing demand for non-yielding assets like Bitcoin. Conversely, if monetary policy begins shifting toward accommodation, it typically proves beneficial for risk assets including the leading cryptocurrency.
The relationship between macroeconomic conditions and cryptocurrency prices has become more pronounced as institutional investment in Bitcoin has grown. Large pension funds and endowments now track BTC as a legitimate asset class, and they adjust their positions based on the same macroeconomic signals that influence their other investment decisions. Understanding the interest rate outlook and inflation trajectory therefore provides valuable context for predicting Bitcoin price movements toward the $42,000 to $44,000 level.
Geopolitical Uncertainty and Safe-Haven Demand
Paradoxically, while Bitcoin is sometimes viewed as a risk asset during bull markets, it also functions as a safe-haven asset during periods of extreme geopolitical or financial uncertainty. Historical episodes of significant geopolitical tension have occasionally driven BTC higher as investors seek to hedge against systemic financial risks. The current geopolitical environment may be providing some support to Bitcoin prices and reducing the potential for even sharper declines below the identified support zone.
Expert Perspectives and Analyst Opinions on Bitcoin Bottom
Professional cryptocurrency analysts and Bitcoin experts have offered varying perspectives on whether $42,000 to $44,000 represents a meaningful bottom or merely a temporary pause before further declines.
Bull Case for Bitcoin Recovery
Prominent crypto analysts who expect Bitcoin to recover from current levels point to several compelling factors. They emphasize that the cryptocurrency maintains structural advantages as a decentralized digital currency that operates independently of government monetary policy. These analysts argue that the long-term trend for Bitcoin remains upward, and current prices represent an excellent opportunity for long-term investors with the conviction to hold through bearish cycles. They often cite the halving cycle of Bitcoin, which is expected to occur and potentially catalyze significant price appreciation as scarcity increases.
Bear Case and Further Downside Risks
Conversely, more cautious crypto analysts suggest that additional downside risk may exist below the $42,000 to $44,000 level. These observers point to elevated debt levels in the global economy, persistent inflation, and the possibility of a prolonged recession as factors that could depress asset prices across the board, including Bitcoin. They argue that the cryptocurrency has not yet proven its worth as an inflation hedge during periods of true economic hardship, and that the institutional adoption that many bulls celebrate could reverse if economic conditions deteriorate significantly.
Risk Factors That Could Push Bitcoin Below $42K
While the $42,000 to $44,000 support level appears technically significant, several black swan events or fundamental shifts could push Bitcoin below this zone.
Regulatory Developments and Government Actions
Unexpected cryptocurrency regulation from major governments could significantly impact Bitcoin price. If regulatory bodies suddenly implemented stricter rules on digital asset trading or ownership, it could trigger sharp declines regardless of technical support levels. Conversely, regulatory clarity that clarifies the legal status of Bitcoin could prove supportive and help establish the $42,000 to $44,000 level as a meaningful bottom.
Major Exchange Issues or Systemic Risks
Historical cryptocurrency incidents involving exchange failures or security breaches have occasionally triggered sharp market declines. While the industry has matured significantly, the possibility of a major event impacting one of the largest crypto exchanges remains a tail risk that could overwhelm technical support levels and push Bitcoin dramatically lower.
Entry Strategies for Bitcoin Investors Around Support Levels
For investors who believe Bitcoin is approaching a bottom near $42,000 to $44,000, thoughtful entry strategies can help maximize long-term returns while managing risk.
Dollar-Cost Averaging Approach
Rather than attempting to time the exact bottom, many experienced Bitcoin investors employ a dollar-cost averaging strategy, purchasing fixed amounts of BTC at regular intervals as prices decline. This approach removes the emotional component from decision-making and ensures that investors are adding to positions during the bearish phase when prices are most attractive. By accumulating gradually through the support zone, investors can achieve a favorable average entry price while reducing the risk of mistiming a single large purchase.
Setting Buy Orders at Key Levels
Another strategy involves placing limit buy orders at predetermined levels within the support zone and below it, creating a systematic approach to accumulation. BTC traders who use this methodology effectively create a buying plan that captures opportunities if Bitcoin price bounces or continues declining further. The discipline of having a pre-planned strategy helps investors avoid panic and maintain their long-term perspective during volatile market conditions.
Conclusion
The question of whether Bitcoin will find a durable bottom at the $42,000 to $44,000 level remains one of the most pressing questions in the cryptocurrency market. The evidence is compelling but not conclusive: technical support levels align with this zone, on-chain indicators show signs of institutional accumulation, and market sentiment has reached levels that historically precede recoveries. However, significant macroeconomic headwinds and regulatory uncertainties ensure that downside risks remain.
For long-term Bitcoin investors with conviction in the asset class, current prices likely present attractive entry opportunities regardless of whether this specific level marks the absolute bottom. The cryptocurrency market has consistently surprised skeptics throughout its history, and periods of maximum pessimism have often preceded substantial recovery periods. Whether you’re looking to establish a first position in Bitcoin or add to existing holdings, the $42,000 to $44,000 support range appears to offer a reasonable risk-reward profile for the next phase of the digital asset journey.
The path forward will ultimately be determined by how macroeconomic conditions evolve, how regulatory frameworks develop, and how quickly institutional and retail investors regain confidence in risk assets like cryptocurrency. Regardless of what happens next, the Bitcoin story remains one of the most fascinating experiments in monetary innovation and decentralized finance.
