



Ethereum (ETH) has broken through critical moving average clusters, establishing a bullish technical setup as the second-largest cryptocurrency by market capitalization continues its recovery effort in August 2026. With the digital asset trading near $1,923, traders and investors are closely monitoring whether ETH can sustain momentum above its short-term moving averages and eventually test the psychologically important $2,000 level. This price action represents a crucial inflection point for the ethereum price and holds significant implications for the broader cryptocurrency market sentiment.
The recent push higher comes after Ethereum consolidated in a tight range throughout July, with the price action showing signs of exhaustion that many technical analysts interpreted as potential capitulation. Now, with ETH price climbing above its 7-day and 14-day moving averages, the narrative has shifted from defensive positioning to cautious optimism. Understanding the ethereum technical analysis framework and the key levels driving this move is essential for anyone tracking ETH market dynamics in real-time.
Ethereum Technical Analysis: Breaking Through Key Moving Averages
The recent ethereum price movement reveals a market structure that has transitioned from consolidation into a potential breakout pattern. Ethereum’s ability to clear its 7-day moving average at $1,877.73 and the 14-day moving average at $1,889.69 signals a shift in short-term momentum that should not be overlooked by traders analyzing ETH chart patterns. The 50-day simple moving average stands at $1,782.82, providing a robust layer of dynamic support beneath the current price, while the 200-day moving average sits at $2,087.95, acting as a medium-term resistance target.
What makes the current ethereum price analysis particularly interesting is the confluence of technical indicators suggesting balanced market conditions. The Relative Strength Index (RSI) currently trades in neutral territory around 50.26, indicating neither overbought nor oversold conditions. This suggests that Ethereum still has room to move higher before reaching extremes that typically precede reversals. Additionally, the Money Flow Index at 38.57 shows capital still moving outward, but without reaching the deep oversold territory below 30 that would signal capitulation.
Support and Resistance Zones
The $1,877–$1,890 zone represents the most critical immediate resistance for the near-term ethereum trajectory. This clustering of the 7-day and 14-day moving averages creates a powerful technical barrier that bulls must overcome with conviction. A clean daily close above $1,889.69 would flip the short-term bias decidedly bullish and could open the pathway back toward $1,920–$1,960, with the ultimate target of $2,000 coming into focus.
On the downside support for ethereum, the $1,828.50 level represents the session low and serves as the first line of defense. This level is reinforced by the 30-day moving average at $1,858.44 just above it, creating a support zone that has proven resilient during recent volatility. If ETH price were to break below $1,828, the next meaningful demand zone would emerge near $1,760, representing a more extended pullback that would invalidate the current bullish setup.
The Role of Moving Averages in Ethereum Trading
Moving averages are fundamental tools for any trader monitoring ethereum price action, providing traders with clarity on both short-term momentum and longer-term directional bias. The simple moving average (SMA) across multiple timeframes tells a compelling story about where ethereum stands within its broader market context.
When we examine the daily SMA structure for ethereum, the SMA 10 at $1,890.36 sits just above the current price, acting as immediate resistance. The SMA 20 at $1,887.49 and SMA 50 at $1,782.82 reinforce this technical framework, with each subsequent longer-period moving average providing a strategic level that traders monitor for entry and exit opportunities. What distinguishes the current ethereum technical setup is how these averages are beginning to align bullishly, with price consolidating above most short-term moving averages while the longer-term averages slope upward.
Exponential Moving Averages and Momentum Confirmation
The exponential moving average (EMA) system provides a more responsive view of recent price momentum compared to simple moving averages. changehero.io The EMA 5 at $1,871.90 and EMA 10 at $1,878.92 show that recent price action has been supportive, with momentum gradually building. For traders seeking to understand whether the current ethereum rally has genuine buying conviction or represents merely a relief bounce, the EMA system offers critical confirmation.
The EMA 50 at $1,848.45 serves as a dynamic support level that would alert traders to weakness if ETH price were to fall below it. More significantly, the EMA 200 at $2,179.60 positions the long-term trend squarely in bullish territory, suggesting that despite near-term consolidation, the broader ethereum market structure remains favorable for upside moves. This hierarchical arrangement of moving averages—where shorter-period moving averages support longer-period ones—creates the technical foundation for sustained momentum toward the $2,000 target.
Momentum Indicators Suggest Building Upside Potential
Beyond moving averages, several key ethereum technical indicators point toward developing strength that could propel ETH price toward $2,000 and beyond. The MACD (Moving Average Convergence Divergence) indicator currently shows positive readings at 3.94, suggesting that momentum is indeed building rather than waning. In ethereum technical analysis, MACD crossovers represent pivotal moments when institutional and algorithmic traders often increase their positions.
The Average Directional Index (ADX) at 44.919 indicates strong directional movement, which is particularly bullish considering that the price is breaking upward rather than downward. When ADX levels exceed 40, traders recognize that a strong trend is firmly established, and ethereum price breakouts tend to follow through with greater conviction. The Williams %R indicator at -43.175 further confirms that recent weakness has been largely absorbed, with the market transitioning into accumulation phases.
RSI Dynamics and Overbought/Oversold Conditions
The Relative Strength Index for ethereum remains in healthy neutral territory, providing evidence that there is sufficient room for ETH price to continue higher without immediately encountering the overbought conditions (RSI above 70) that typically precede corrective pullbacks. At current levels around 57, the RSI for ethereum suggests that buying momentum is present but not excessive, which is precisely the kind of setup that supports longer-duration rallies.
This measured momentum environment means that ethereum traders can participate in the push toward $2,000 without worrying that the market is immediately at a reversal risk from technical extremes. The historical patterns in ethereum price action show that when RSI remains between 50 and 70 while prices break above moving averages, continuation patterns often unfold over multiple sessions or even weeks.
Market Structure and Volume Analysis Supporting the Ethereum Rally
Volume patterns provide crucial confirmation for any ethereum price breakout, separating genuine moves from false signals that trap traders. Recent ethereum chart analysis reveals that volume has begun to pick up as price has moved above key moving averages, suggesting that institutional participation is increasing. The current daily turnover of approximately $57.26 million USD in the ethereum futures market reflects heightened interest from derivative traders positioning for further upside.
The fact that selling volume has not intensified even as ethereum price has consolidated demonstrates important market psychology. Typically, when strong sellers emerge and want to cap upside, they do so with aggressive volume. The absence of such selling pressure, combined with the measured buying that has driven ETH price higher, suggests that the market structure remains constructive.
Ethereum Futures Market Setup
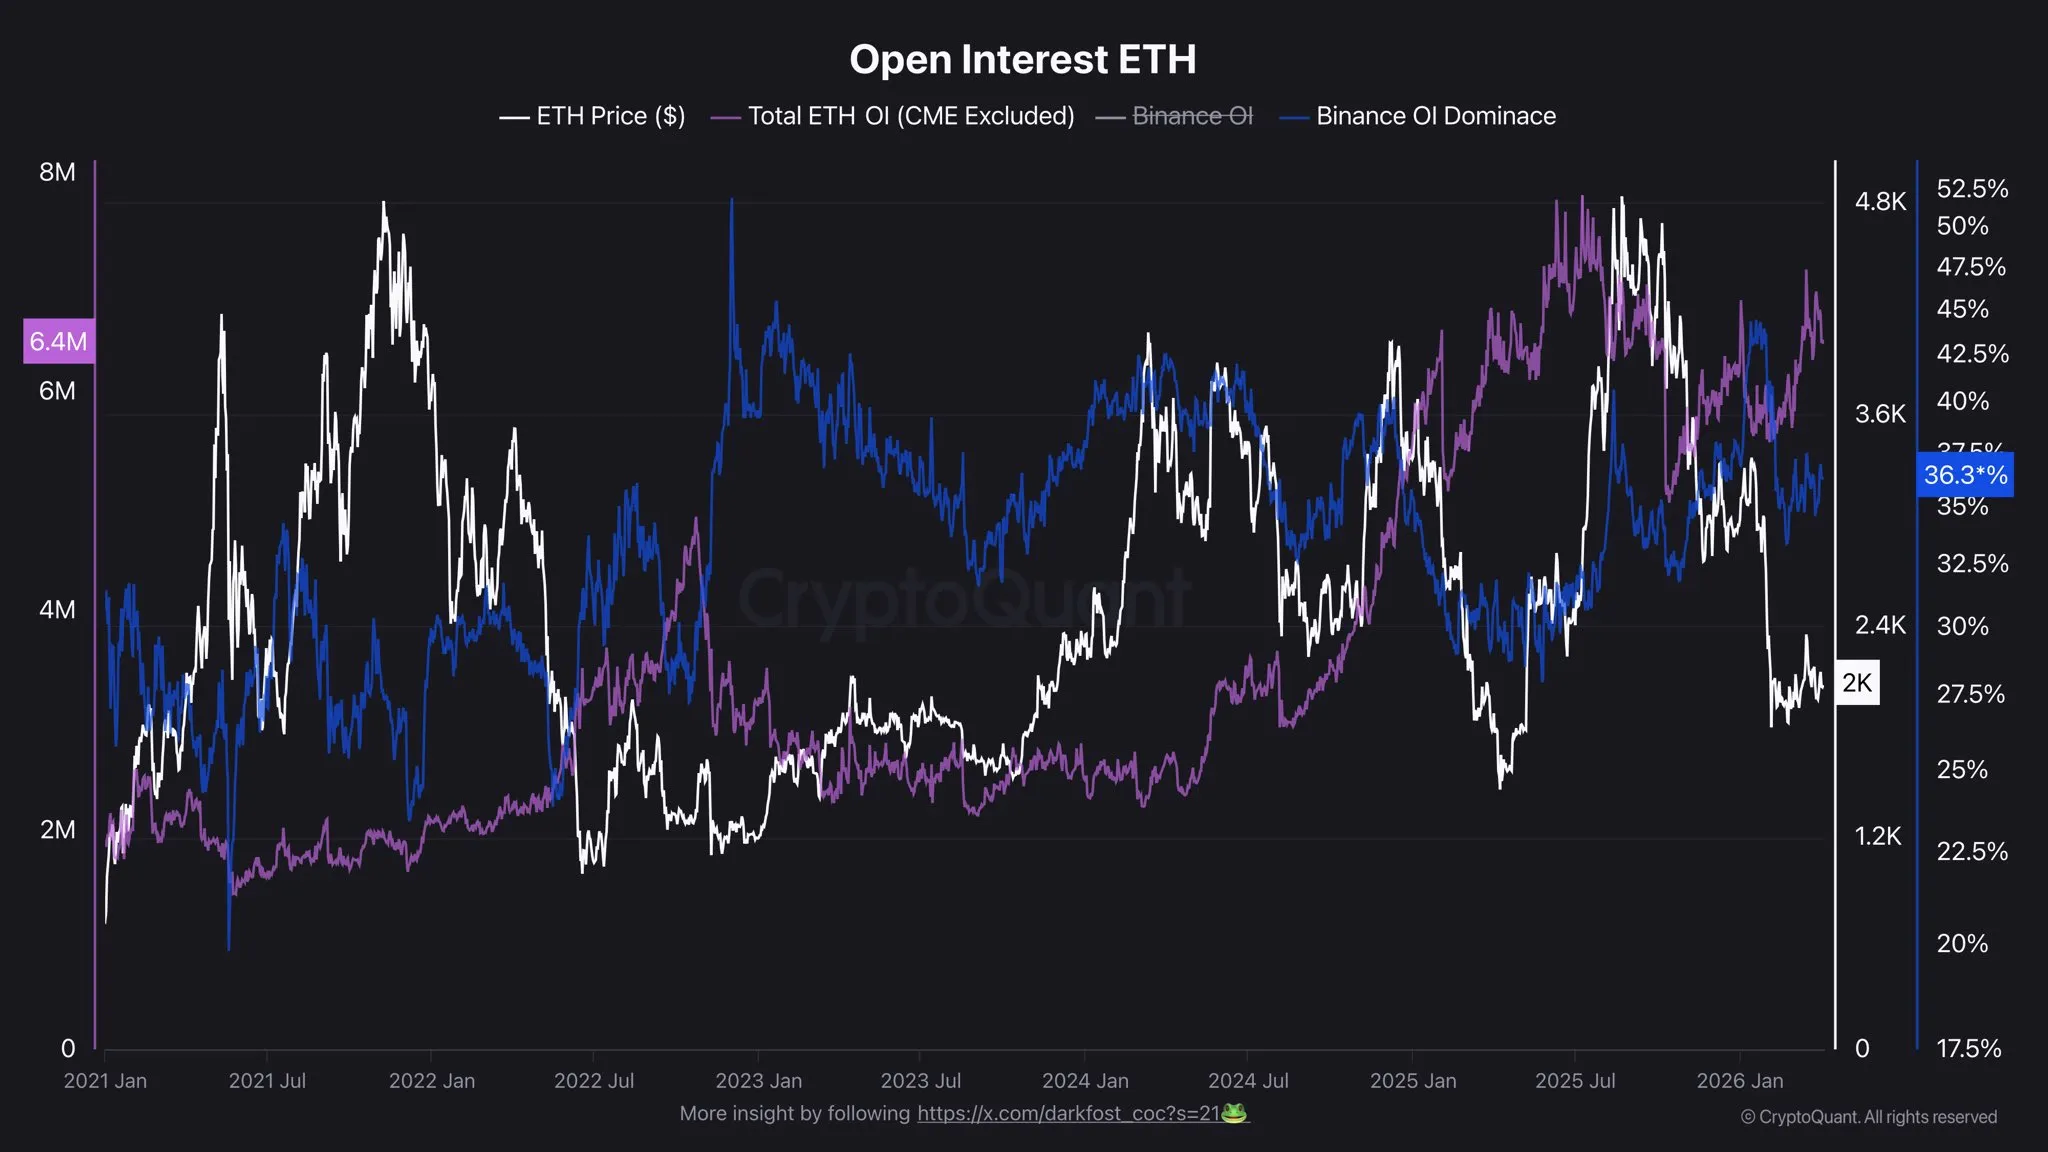
The ethereum perpetual futures market provides additional insight into how sophisticated traders are positioning for the ethereum price advance. phemex.com With open interest at 91,525 ETH and funding rates at only 0.0058% per 8-hour cycle, the market remains balanced. When ethereum futures funding rates climb excessively positive, it signals that longs are over-leveraged and vulnerable to liquidation cascades. The current modest positive funding indicates healthy demand without the frothy excess that precedes sharp reversals.
The Path to $2,000: Technical Targets and Psychological Levels
Ethereum’s push toward $2,000 represents much more than just another technical level—it carries significant psychological weight for the entire digital asset community. binance.com The $2,000 price level has proven to be a critical turning point throughout ethereum’s history, serving as a focal point where institutions rebalance their portfolios and retail traders evaluate their risk exposure.
Intermediate Technical Targets
Before reaching the $2,000 mark, ethereum price must overcome several intermediate resistance zones. The $1,950–$1,960 zone represents the first meaningful hurdle, where previous support has turned into resistance. Breaking through this area with volume would signal that bulls have genuine conviction about testing $2,000. Beyond that, the $1,980–$1,990 range may see profit-taking, as traders who accumulated ethereum near the lows look to lock in gains near round numbers.
If ethereum clears $2,000 decisively on a strong daily close, the next resistance targets would shift toward $2,100 and ultimately the $2,200–$2,300 zone that represents the previous 2026 trading range highs. Multiple analyst targets for ethereum in the medium term cluster around $2,200–$2,500, suggesting that breaking past $2,000 could catalyze further upside as algorithmic systems recognize the breakout and other traders chase the move.
Historical Significance of the $2,000 Level
The ethereum price at $2,000 carries historical significance that extends back through previous market cycles. Many long-term ethereum holders accumulated positions near these levels during previous bull markets, meaning that supply could emerge as price approaches this zone. However, the fact that ethereum has traded significantly above $2,000 in 2025—with monthly prices reaching as high as $4,390 in August 2025—suggests that current supply at this level may be limited compared to earlier cycles.
What Drives Ethereum Price in August 2026
The fundamental drivers behind the ethereum price push toward $2,000 requires examining the macro and micro factors influencing market sentiment. phemex.com The ethereum network continues to process substantial transaction volume, with Layer 2 scaling solutions like Arbitrum and Optimism capturing increasing portions of user activity while ethereum mainnet secures the underlying value.
DeFi Activity and Network Utility
Decentralized Finance (DeFi) protocols built on ethereum continue to anchor significant value to the network. The total value locked (TVL) in ethereum-based DeFi protocols remains substantial even as capital has rotated into competing Layer 1 blockchains. This sustained utility provides a fundamental underpinning for ethereum price appreciation, separate from purely speculative technical considerations.
Ethereum Staking and Deflationary Mechanics
Ethereum’s transition to proof-of-stake has introduced deflationary dynamics that support ethereum price through supply reduction mechanisms. changehero.io The current ETH burn rate and staking yields around 4-5% annually create compelling reasons for long-term capital to remain committed to ethereum positions. As more capital flows into ETH staking, the circulating supply available for trading decreases, potentially supporting higher price levels.
Analyst Price Targets and Market Expectations for Ethereum
Professional analysts and prediction markets have developed varying outlooks for ethereum in 2026, reflecting genuine uncertainty about which factors will dominate. phemex.com The consensus base case for ethereum 2026 sits around $4,500, contingent on network upgrades launching on schedule and institutional demand recovering. However, the more conservative institutional forecasts from entities like Citigroup model ethereum at around $3,175 for the year, reflecting concerns about regulatory delays in the United States.
Short-term Price Projections
For the immediate horizon through September 2026, multiple forecasting models cluster around $2,200–$2,500, suggesting that the path toward $2,000 may represent just the first leg of a larger advance. binance.com Ethereum price prediction for September 2026 indicates a possible range with lows near $1,498 and highs extending toward $3,178, with average predictions near $2,338, implying substantial upside potential from current levels.
Longer-term Ethereum Outlook
For 2027, ethereum analysts project an average price near $2,033, reflecting the maturation of various scaling solutions and the stabilization of regulatory frameworks. binance.com This suggests that even in a more conservative scenario, ethereum could trade meaningfully above $2,000 on a sustained basis, with the critical question being whether the asset captures further upside or consolidates in the $2,000–$2,500 range for an extended period.
Risk Factors That Could Derail the Ethereum Rally
While the technical setup for ethereum price appears constructive, investors must acknowledge the risks that could interrupt the push toward $2,000. Regulatory headwinds, particularly increased scrutiny from U.S. authorities, could trigger sharp reversals in ethereum price. Any negative regulatory developments could see ETH price quickly retreat below the $1,900 support level and potentially test the $1,800 zone.
External Market Risks
Macroeconomic factors, including shifts in monetary policy or unexpected economic weakness, could reduce demand for risk assets like ethereum. Additionally, crypto-specific contagion risks, such as failures at major exchanges or lending platforms, could trigger forced liquidations that hammer ethereum price lower regardless of the underlying technical setup.
Conclusion
Ethereum’s push through key moving averages toward $2,000 represents a meaningful technical development with implications extending well beyond the immediate price action. The ethereum technical setup currently shows alignment of multiple moving averages, positive momentum indicators, and balanced market structure that supports further upside. With the 50-day, 100-day, and 200-day moving averages positioned supportively, ETH price has established the technical foundation for a sustained advance toward the psychologically important $2,000 level and potentially much higher targets in the $2,200–$2,500 range.
For traders and investors monitoring ethereum price action, the key is to watch for a clean break above $1,889.69 with accompanying volume confirmation. If the moving averages continue to line up positively and momentum indicators remain supportive, the path toward $2,000 ethereum price and beyond becomes increasingly probable. However, maintaining strict risk management and respecting support levels at $1,828.50 and $1,760 will be critical if the market structure unexpectedly reverses.
The current ethereum market conditions suggest that patient bulls who have positioned ahead of this push could be rewarded, but new entrants should wait for additional confirmation that the move has sufficient staying power. The ethereum technical analysis framework provides a roadmap, but execution and volume confirmation will ultimately determine whether this rally carries through to target.
