


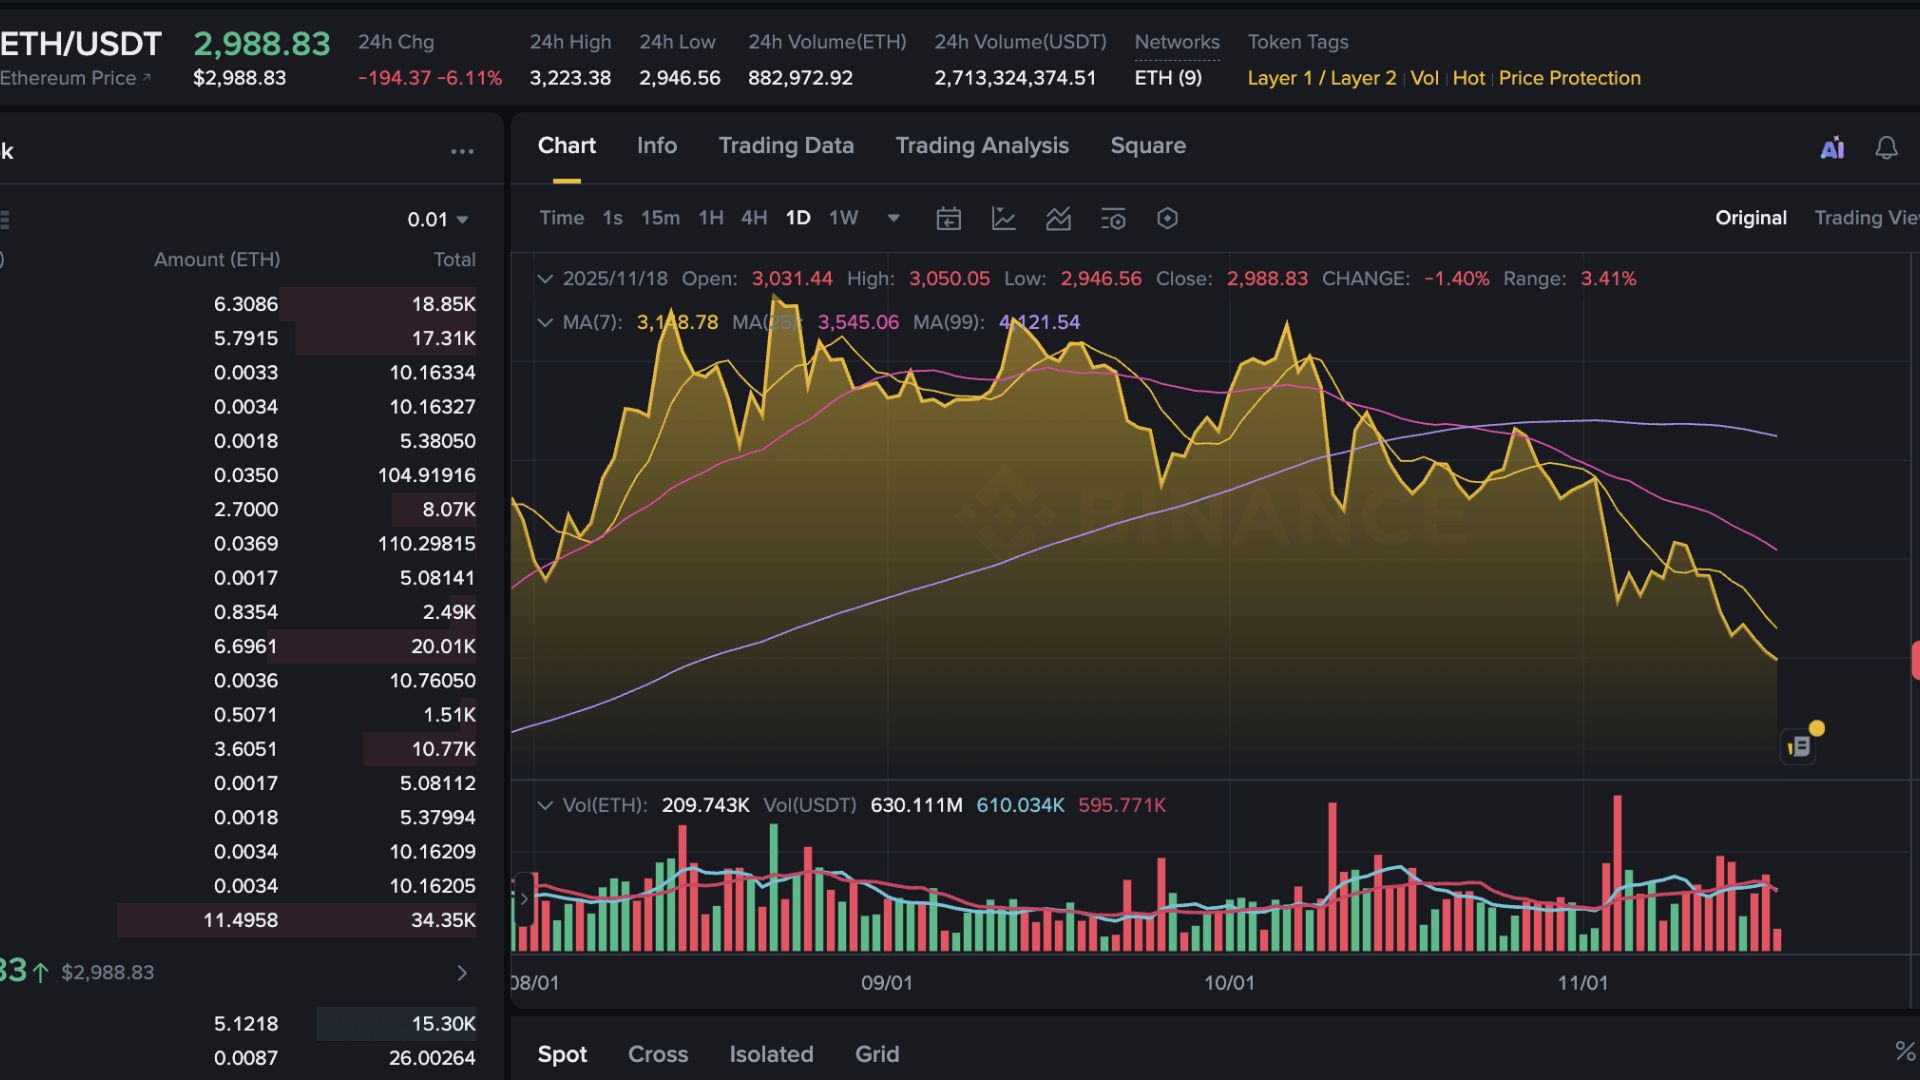
Ethereum (ETH) continues to hold its position as the second-largest cryptocurrency by market capitalization and one of the most important blockchain networks in the digital asset space. As the foundation for decentralized finance (DeFi), non-fungible tokens (NFTs), Layer-2 scaling solutions, and thousands of decentralized applications (dApps), Ethereum plays a central role in the broader crypto ecosystem. Because of this influence, even modest changes in ETH price often affect investor sentiment across the entire market.
Recently, analysts have pointed to a bearish rounding top forming on Ethereum’s price chart, a pattern that may signal weakening momentum and the possibility of further downside. Technical projections suggest that if selling pressure continues, Ethereum price could move toward the $1,650 support level. While chart patterns do not guarantee future outcomes, they remain useful tools for understanding market psychology and identifying possible trend reversals.
The current market environment is shaped by a mix of bullish long-term fundamentals and short-term technical weakness. Ethereum continues to benefit from institutional interest, growing staking participation, and the expansion of Layer-2 ecosystems. At the same time, macroeconomic uncertainty, declining trading volume, profit-taking, and cautious investor sentiment have created pressure on ETH in the near term.
What Is a Bearish Rounding Top Pattern?
A bearish rounding top is a technical chart formation that often appears near the end of an upward trend. Unlike sharp reversal patterns that form quickly, a rounding top develops gradually over time. Prices rise steadily at first, but as momentum weakens, the curve begins to flatten and eventually turns downward, creating a shape that resembles an upside-down bowl.
This pattern reflects a shift in market psychology. Early in the formation, buyers remain in control and push prices higher. As the trend matures, buying pressure begins to fade, and sellers slowly gain influence. Once the price breaks below important support levels, the pattern can signal the start of a larger correction or even a new downtrend.
Although not every rounding top leads to a major decline, technical analysts pay close attention to this formation because it has historically preceded trend reversals in many financial markets. In Ethereum’s case, the appearance of this pattern suggests that bullish momentum may be fading and that traders should prepare for possible volatility.
Why Analysts Are Watching the $1,650 Level
The $1,650 support level has become a key area of interest for Ethereum traders because it represents an important technical zone based on previous market behavior. Support levels are price areas where buying demand has historically been strong enough to slow or reverse a decline. When a market approaches such a level, traders often watch closely to see whether buyers step in.
If Ethereum loses intermediate support while the rounding top completes, technical analysis suggests that $1,650 could become the next major area where buyers attempt to defend the price. This does not mean ETH will automatically fall to that level, but it does mean the market may test it if bearish momentum continues.
Support levels are never guaranteed to hold. Their strength depends on trading volume, investor sentiment, macroeconomic conditions, and overall demand for cryptocurrencies. If market confidence weakens further, Ethereum could move through support more quickly than expected. On the other hand, strong buying interest could prevent the decline and trigger a rebound before ETH reaches that zone.
Ethereum’s Current Market Structure
Ethereum is currently in a phase of transition. After previous rallies, momentum has slowed as buyers and sellers compete for control. This kind of price action often appears during consolidation periods or before a trend reversal. The market is no longer showing the same strength that supported earlier bullish moves, and that shift has made traders more cautious.
Trading volume has also declined compared with stronger bullish phases. Lower volume often indicates reduced participation, which can make it harder for prices to sustain upward movement. When price continues to rise while volume weakens, analysts often interpret that as a sign that buyers are losing conviction.
At the same time, Ethereum’s long-term fundamentals remain strong. Institutional investors continue to monitor ETH because of its role in decentralized finance, tokenization, and blockchain infrastructure. This creates a mixed outlook in which short-term technical weakness coexists with long-term ecosystem growth. That combination makes Ethereum especially important to watch during periods of market uncertainty.
Technical Indicators Supporting the Bearish Case
Declining Trading Volume
One of the clearest signals supporting the bearish case is declining trading volume. Healthy uptrends are usually backed by strong and rising volume because that shows broad participation from buyers. When prices continue climbing without volume confirmation, the move may be losing strength.
Ethereum’s recent volume patterns suggest that fewer traders are actively participating than during earlier bullish phases. This reduced activity aligns with the formation of a rounding top and raises the possibility that the market is preparing for a deeper correction. If volume continues to weaken while price struggles to hold key levels, bearish pressure could intensify.
Relative Strength Index (RSI)
The Relative Strength Index (RSI) is another important indicator used by traders to measure momentum. It compares recent gains and losses to determine whether an asset may be overbought or oversold. When bullish momentum weakens, RSI often begins to trend lower, reflecting fading strength in the market.
In Ethereum’s case, a declining RSI would support the idea that buyers are losing control. While RSI alone cannot predict the future, it becomes more meaningful when combined with other bearish signals such as falling volume and a rounding top pattern. Together, these indicators can strengthen the case for a possible move toward lower support levels.
Moving Averages
Moving averages help traders identify the broader direction of a market. Short-term moving averages crossing below longer-term averages can signal that bearish momentum is building. These crossovers are closely watched because they often confirm that a trend is shifting from bullish to bearish.
For Ethereum, traders are monitoring whether price remains above key moving averages or begins to break below them. If ETH loses support from these trend lines, it could reinforce the bearish outlook and increase the likelihood of a move toward $1,650. On the other hand, a strong rebound above moving averages could weaken the bearish setup and restore confidence.
Market Sentiment Is Becoming More Cautious
Investor psychology plays a major role in cryptocurrency markets. When sentiment is positive, traders are more willing to buy dips and hold positions through volatility. When sentiment turns cautious, however, demand often weakens and selling pressure increases. Ethereum is currently experiencing a more cautious market tone as traders weigh long-term optimism against short-term uncertainty.
Many investors still believe in Ethereum’s future, but they are hesitant to increase exposure while technical signals remain weak. This hesitation can reduce trading activity and make it harder for ETH to recover quickly. In a market driven heavily by sentiment, even a small shift in confidence can have a large effect on price direction.
Because sentiment can change rapidly, Ethereum traders need to monitor news flow, market reactions, and broader crypto trends closely. A sudden improvement in sentiment could help ETH stabilize, while further caution could deepen the current correction.
On-Chain Data Provides Additional Context
Blockchain analytics offer valuable insight into Ethereum’s market behavior beyond what price charts alone can show. On-chain data helps traders understand whether holders are accumulating, selling, or moving assets in ways that may affect future price action.
Exchange Balances
One important metric is the amount of Ethereum held on exchanges. When ETH transfers to exchanges increase, it often suggests that investors may be preparing to sell. Higher exchange balances can therefore indicate rising potential selling pressure. In contrast, declining exchange balances may point to accumulation and reduced immediate supply.
Monitoring exchange inflows and outflows can help analysts estimate whether the market is leaning bearish or bullish. If more ETH continues moving onto exchanges while price weakens, that could support the case for a further decline. If balances fall, it may suggest that holders are preparing for a longer-term move rather than a short-term sale.
Whale Activity
Large Ethereum holders, often called whales, can have a major impact on price trends. Their wallet movements are closely watched because large transfers sometimes precede significant market moves. If whales begin accumulating ETH during a correction, that can help stabilize the market. If they start selling aggressively, however, the price may fall more quickly.
Whale activity is especially important during periods of uncertainty because large holders often have better access to market information and stronger conviction in their positions. Their behavior can therefore provide clues about whether the current bearish setup is likely to continue or reverse.
Staking Participation
Ethereum’s proof-of-stake model encourages long-term holding through staking. When more ETH is staked, less of it is available for immediate trading, which can reduce liquid supply and support price stability over time. Rising staking participation is generally viewed as a positive sign for Ethereum’s long-term outlook.
Even if short-term price action remains weak, strong staking activity can help limit downside pressure by removing supply from the market. This does not guarantee a price rebound, but it does create a structural support mechanism that may become more important if selling pressure increases.
Macroeconomic Conditions Continue Influencing ETH

Ethereum no longer trades in isolation from global financial markets. Interest rate decisions, inflation data, employment reports, central bank policy, and geopolitical developments all influence investor appetite for risk assets. Because cryptocurrencies are considered volatile assets, they often react strongly to changes in macroeconomic conditions.
When economic uncertainty rises, investors tend to reduce exposure to speculative markets, including crypto. That can place additional pressure on Ethereum, especially if technical indicators are already weak. On the other hand, improving macroeconomic conditions can restore confidence and encourage renewed buying across digital assets.
This means Ethereum’s short-term direction depends not only on blockchain-specific developments but also on the broader financial environment. Traders who ignore macroeconomic signals may miss important clues about where ETH could move next.
Institutional Interest Remains Strong
Despite the current bearish technical setup, institutional interest in Ethereum continues to grow. Asset managers and large investors increasingly recognize Ethereum’s importance as the infrastructure layer for decentralized applications, stablecoins, tokenized assets, and smart contracts. This long-term adoption story remains one of Ethereum’s strongest advantages.
Institutional investors often operate on longer time horizons than retail traders. That means they may continue building positions even during periods of short-term weakness. Their participation can help support Ethereum’s long-term value proposition, even if it does not immediately prevent a price decline.
This distinction between short-term speculation and long-term investment is important. While traders may focus on the possibility of a drop to $1,650, institutions are often more concerned with Ethereum’s role in the future of blockchain infrastructure. That broader perspective helps explain why ETH remains one of the most closely watched assets in the crypto market.
Layer-2 Growth Supports Ethereum’s Ecosystem
Ethereum’s ecosystem continues to expand through Layer-2 scaling solutions, which are designed to reduce transaction costs and improve network speed. These networks play a major role in making Ethereum more usable for everyday applications and broader adoption. As Layer-2 activity grows, Ethereum’s long-term utility becomes stronger.
This ecosystem growth matters because it supports the network’s value beyond short-term price movements. Even if ETH faces temporary weakness, continued development across Layer-2 platforms, DeFi protocols, and blockchain applications helps reinforce Ethereum’s position as a leading smart contract network.
Developer activity also remains strong, which is another positive sign for the network’s future. A healthy development environment often attracts more users, more applications, and more capital over time. That long-term strength may eventually outweigh the current bearish technical pattern.
Risks That Could Push Ethereum Lower
Several risks could contribute to additional downside pressure on Ethereum. Persistent macroeconomic uncertainty may continue to weaken investor confidence. Declining trading volume could reduce buying support. Large-scale profit-taking by whales or institutions could accelerate selling. Unexpected regulatory developments could also create short-term fear in the market.
If several of these factors occur at the same time, Ethereum could test lower support levels, including the widely watched $1,650 zone. In that scenario, traders would likely look for signs of stabilization before assuming the correction has ended. Until then, the market may remain vulnerable to further volatility.
Factors That Could Prevent the Decline
Although the bearish rounding top is a meaningful technical signal, it does not guarantee that Ethereum will fall to $1,650. Several developments could invalidate the pattern. Strong institutional buying could absorb selling pressure. Positive regulatory news could improve sentiment. Rising demand for staking and DeFi applications could increase long-term accumulation. Better macroeconomic conditions could also encourage investors to return to risk assets.
Technical analysis is probabilistic, not certain. That means traders should treat bearish signals as warnings rather than predictions. If buyers step in aggressively at current levels, Ethereum could recover before reaching the projected downside target. This is why confirmation from multiple indicators is so important.
Trading Strategies During Market Uncertainty
Investors often respond differently depending on their goals and time horizon. Short-term traders may focus on support and resistance levels, using strict risk management to protect capital during volatile moves. Long-term investors, by contrast, may pay more attention to Ethereum’s adoption, ecosystem growth, and network fundamentals than to temporary price swings.
A common approach during uncertain markets is dollar-cost averaging, which allows investors to build exposure gradually rather than trying to time the exact bottom. This strategy can reduce emotional decision-making and help smooth out volatility over time. Regardless of the method used, disciplined risk management remains essential in a market as unpredictable as crypto.
Avoiding emotionally driven decisions is especially important when technical patterns appear bearish. Panic selling can lock in losses, while impulsive buying can expose investors to unnecessary risk. A balanced strategy based on research and patience is usually more effective.
Long-Term Outlook for Ethereum
Even though technical analysis currently points to possible downside, Ethereum’s long-term outlook remains supported by strong fundamentals. The network continues to lead in decentralized finance innovation, developer activity, institutional adoption, and tokenization use cases. Layer-2 growth is also improving scalability and user experience, which strengthens Ethereum’s position in the market.
These long-term strengths matter because they show that Ethereum’s value is not based solely on short-term price action. The network remains one of the most important pieces of blockchain infrastructure in the world. While temporary corrections are possible, the broader adoption trend continues to support Ethereum’s relevance and potential.
For investors with a long-term horizon, the current bearish setup may be viewed as a period of caution rather than a sign that Ethereum’s broader story has changed. The market may remain volatile, but the underlying ecosystem continues to evolve.
What Investors Should Watch Next
Over the coming weeks, several indicators will be important for understanding Ethereum’s next move. Price behavior around major support levels will be especially significant. If ETH holds above key zones, the bearish setup may weaken. If it breaks lower with strong volume, the case for a move toward $1,650 becomes stronger.
Trading volume should also be monitored closely because a meaningful trend reversal usually requires stronger participation. Institutional activity may provide additional clues about whether larger investors are accumulating or reducing exposure. On-chain metrics such as exchange balances, staking participation, and whale movements can help confirm whether the market is leaning bullish or bearish.
Macroeconomic developments will continue to matter as well. Interest rate expectations, inflation data, and broader risk sentiment can all influence Ethereum’s direction. By combining technical, on-chain, and macroeconomic analysis, investors can build a more complete view of the market than chart patterns alone can provide.
Conclusion
The appearance of a bearish rounding top has placed Ethereum under closer scrutiny as analysts consider the possibility of a decline toward $1,650. This technical formation suggests that bullish momentum may be fading and that selling pressure could increase if support levels fail. However, it is only one part of a much larger market picture.
Short-term challenges such as declining trading volume, cautious sentiment, macroeconomic uncertainty, and technical resistance may continue to weigh on ETH. At the same time, Ethereum’s long-term fundamentals remain strong. Institutional interest is growing, staking participation remains significant, Layer-2 adoption is expanding, and the network continues to serve as the backbone of decentralized finance and smart contract innovation.
Investors should remember that technical analysis identifies probabilities, not certainties. Market conditions can change quickly, especially in cryptocurrency markets. By watching support levels, on-chain data, macroeconomic trends, and institutional activity, traders and investors can make more informed decisions while managing risk more effectively.
Whether Ethereum eventually reaches the $1,650 target or finds support earlier, its long-term role as one of the most important blockchain networks remains intact. Patience, disciplined analysis, and a diversified approach remain the best tools for navigating crypto market volatility.
